Search Knowledge Base by Keyword
-
App Creation
-
- Creating a Designer Application
- User Interface
- Pages and Navigation
- Database
- Print Process
- Email Process
- Excel Export
- Stylesheets
- Custom Actions
- Text Resource (Run-time) Editor
- Queries
- Goal Seek Event
- Solver Event
- Application
-
- Sections
- Containers
- Textbox
- Checkbox
- Dropdown
- Radio Button
- Calendar
- File Upload
- Input Grids
- Slider
- Content
- Output Grid
- Charts
- Maps
- Gauges
- Action Button
- Show all articles ( 1 ) Collapse Articles
-
-
App Management
-
Data Management
-
Users and Teams
-
Developers
-
-
- GetDocumentStubs (Application-Level)
- GetRecordExtended (Application-Level)
- GetRecord (Application-Level)
- GetBatchResults (Application-Level)
- GetResult (Application-Level)
- CloseDedicatedSession (Application-Level)
- OpenDedicatedSession (Application-Level)
- SendEmail (Application-Level)
- GenerateDocument (Application-Level)
- MergeDocumentsExtended (Application-Level)
- MergeDocuments (Application-Level)
- DeleteUser (Site-Level)
- UpdateUser (Site-Level)
- CreateUser (Site-Level)
-
-
-
Administration
-
Changelog
- Version 6.27
- Version 6.26
- Version 6.25
- Version 6.24
- Version 6.23
- Version 6.22
- Version 6.21
- Version 6.20
- Version 6.19
- Version 6.18
- Version 6.17
- Version 6.16
- Version 6.15
- Version 6.14
- Version 6.13
- Version 6.12
- Version 6.11
- Version 6.10
- Version 6.9
- Version 6.8
- Version 6.7
- Version 6.6
- Version 6.5
- Version 6.4
- Version 6.3
- Version 6.2
- Version 6.1
- Version 6.0
- Version 5.2
- Version 5.1
- Version 5.0
- Version 4.8
- Version 4.7
- Version 4.6
- Version 4.5
- Version 4.4
- Version 4.3
- Version 4.2
- Version 4.1
- Version 4.0
- Version 3.5
- Version 3.4
- Version 3.3
- Version 3.2
- Version 3.1
- Version 3.0
- Version 2.5
- Version 2.4
- Version 2.3
- Version 2.2
- Version 2.1
- Version 2.0
- Version 1.6
- Version 1.5
- Version 1.4
- Version 1.3
- Version 1.2
- Version 1.1
- Version 1.0
- Show all articles ( 44 ) Collapse Articles
-
Other Features
-
Connectors
-
Integrations
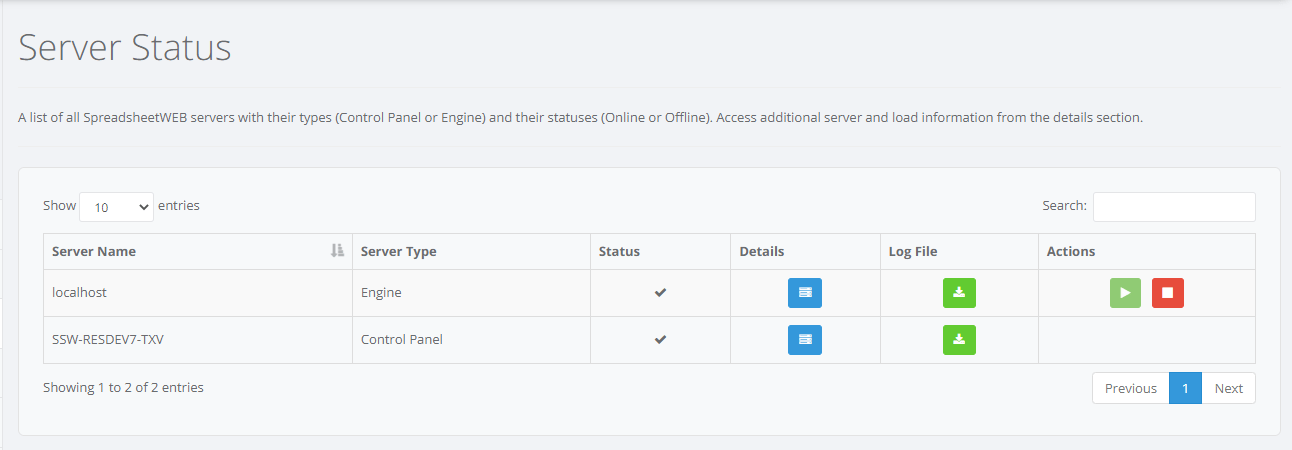
Server Status
Server Status page is designed to monitor servers in the SpreadsheetWEB cluster. It lists all SpreadsheetWEB servers along with Server Type (Control Panel or Engine) and Status (Online√ or Offline X).

Clicking Details icon (![]() ), the System Administrator can view various server parameters. The server details page tracks memory (Memory Usage field) and average CPU usage (The green area chart) real time. System Administrator can also view workbooks loaded on each node on the server along with their memory consumption.
), the System Administrator can view various server parameters. The server details page tracks memory (Memory Usage field) and average CPU usage (The green area chart) real time. System Administrator can also view workbooks loaded on each node on the server along with their memory consumption.
Each node is separated by lines and correspond to a process (has a unique Process ID). A process that has a green dot on its left, means that that node is currently free and is not running any calculations. A red dot means that the node is busy processing calculations. The indicators on the right hand side correspond to the states given below:
| The node has been used in the past 15 minutes. The application on this node is not locked to a user session. |
| The node has been used in the past 15 minutes. The application on this node is locked to a user session. |
| The node hasn’t been used in the past 15 minutes. The application on this node is not locked to a user session. |
This information helps System Administrators to analyze how workbooks consume server resources and design the optimal server and workbook configurations.
Download Log Files
Clicking the Download Log icon (![]() ) the server logging information can be exported as a text file.
) the server logging information can be exported as a text file.