Search Knowledge Base by Keyword
-
App Creation
-
- Creating a Designer Application
- User Interface
- Pages and Navigation
- Database
- Print Process
- Email Process
- Excel Export
- Stylesheets
- Custom Actions
- Text Resource (Run-time) Editor
- Queries
- Goal Seek Event
- Solver Event
- Application
-
- Sections
- Containers
- Textbox
- Checkbox
- Dropdown
- Radio Button
- Calendar
- File Upload
- Input Grids
- Slider
- Content
- Output Grid
- Charts
- Maps
- Gauges
- Action Button
- Show all articles ( 1 ) Collapse Articles
-
-
App Management
-
Data Management
-
Users and Teams
-
Developers
-
-
- GetDocumentStubs (Application-Level)
- GetRecordExtended (Application-Level)
- GetRecord (Application-Level)
- GetBatchResults (Application-Level)
- GetResult (Application-Level)
- CloseDedicatedSession (Application-Level)
- OpenDedicatedSession (Application-Level)
- SendEmail (Application-Level)
- GenerateDocument (Application-Level)
- MergeDocumentsExtended (Application-Level)
- MergeDocuments (Application-Level)
- DeleteUser (Site-Level)
- UpdateUser (Site-Level)
- CreateUser (Site-Level)
-
-
-
Administration
-
Changelog
- Version 6.27
- Version 6.26
- Version 6.25
- Version 6.24
- Version 6.23
- Version 6.22
- Version 6.21
- Version 6.20
- Version 6.19
- Version 6.18
- Version 6.17
- Version 6.16
- Version 6.15
- Version 6.14
- Version 6.13
- Version 6.12
- Version 6.11
- Version 6.10
- Version 6.9
- Version 6.8
- Version 6.7
- Version 6.6
- Version 6.5
- Version 6.4
- Version 6.3
- Version 6.2
- Version 6.1
- Version 6.0
- Version 5.2
- Version 5.1
- Version 5.0
- Version 4.8
- Version 4.7
- Version 4.6
- Version 4.5
- Version 4.4
- Version 4.3
- Version 4.2
- Version 4.1
- Version 4.0
- Version 3.5
- Version 3.4
- Version 3.3
- Version 3.2
- Version 3.1
- Version 3.0
- Version 2.5
- Version 2.4
- Version 2.3
- Version 2.2
- Version 2.1
- Version 2.0
- Version 1.6
- Version 1.5
- Version 1.4
- Version 1.3
- Version 1.2
- Version 1.1
- Version 1.0
- Show all articles ( 44 ) Collapse Articles
-
Other Features
-
Connectors
-
Integrations
Multiples
Created On
bySerap bas
You are here:
You can create multiples of a visualization to include multiple charts, diagrams, or maps inside one visualization box, using an additional data Field. The Field section that determines how many visualizations are to be created can be found under the Multiples tab when creating or editing a visualization.
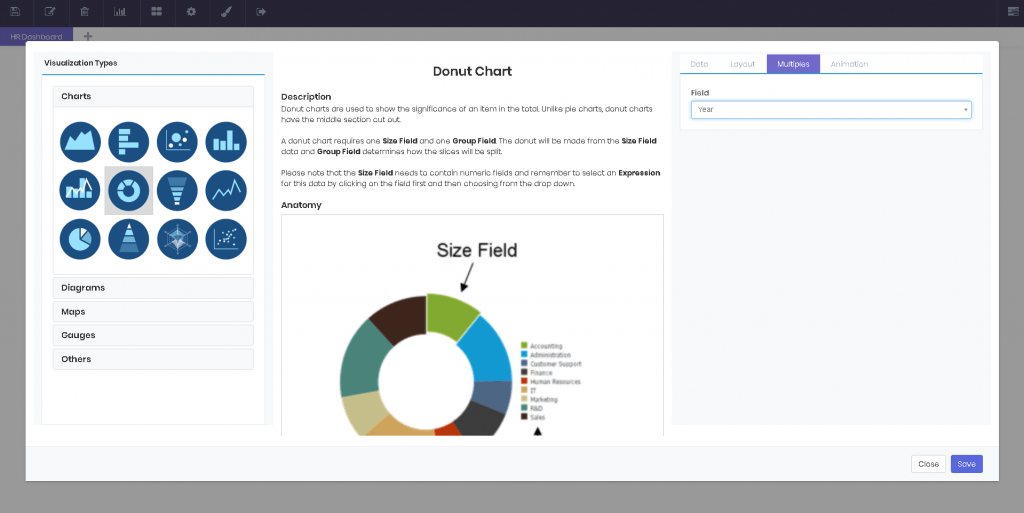
The original visualization will repeat as many times as necessary, creating a number images equal to the number of unique items in the Field section. For example, if the Field data contains the unique values 2005, 2006, 2007, and 2008, the resulting visualization will have 4 charts, each displaying the data for the corresponding year.
