Data Table Columns
There are two types of columns listed in the Data tab:
- Default or System columns are present in every application, providing a consistent data management framework across the platform.
- The second type varies according to the specific context of the application, allowing customization and flexibility to meet the unique needs of each application’s data structure.
Default Columns
SpreadsheetWeb has essential default columns that provide the core structure for efficiently organizing and managing data.

SpreadsheetWeb applications have seven standard columns:
Record Identifier: Acts as a unique identifier for each record, ensuring data integrity and simplifying record management processes.

User: Identifies the individual who has last updated a particular record.

Date Generated: Automatically records the date and time when a new record is added to the database. This feature is critical for monitoring the chronological order of data entries and maintaining an accurate timeline.

Last Update: Mirrors the function of the Date Created column by recording the most recent date and time a record was modified.

Tags: In SpreadsheetWeb Hub, tags act as versatile grouping mechanisms representing a wide range of categories such as companies, roles, or payment levels. This flexible system allows you to create tags tailored to the specific needs of your project or organization.
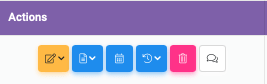
Actions: The Actions column within the Data table facilitates direct, record-specific operations such as opening, editing, downloading or viewing a record’s history, thereby streamlining user interaction with the database.
Users: This column displays the names of all users who have contributed to a specific record.
Context-Specific Columns
Contextual columns adapt to the unique context of each application, reflecting the different data contained in different Excel files. As a result, the information displayed in the data table on SpreadsheetWeb’s data page varies accordingly.

Column settings in the data grid allow users to conveniently customize their view by selecting or hiding columns of interest using the Settings button at the top of the data grid. This feature increases the flexibility and customization of data presentation to meet the specific requirements of each application.

You can remove or modify the column name by clicking the below edit button.

Your customization will be saved once you click the ‘Quit Settings’ button shown below.
